The faster line
Yellow · 9-period EMA.
Tracks recent price changes more closely.
02 / THE EMA OVERLAY
Three familiar moving averages. Two clear crossing conditions. A simple companion to the combined overlay.
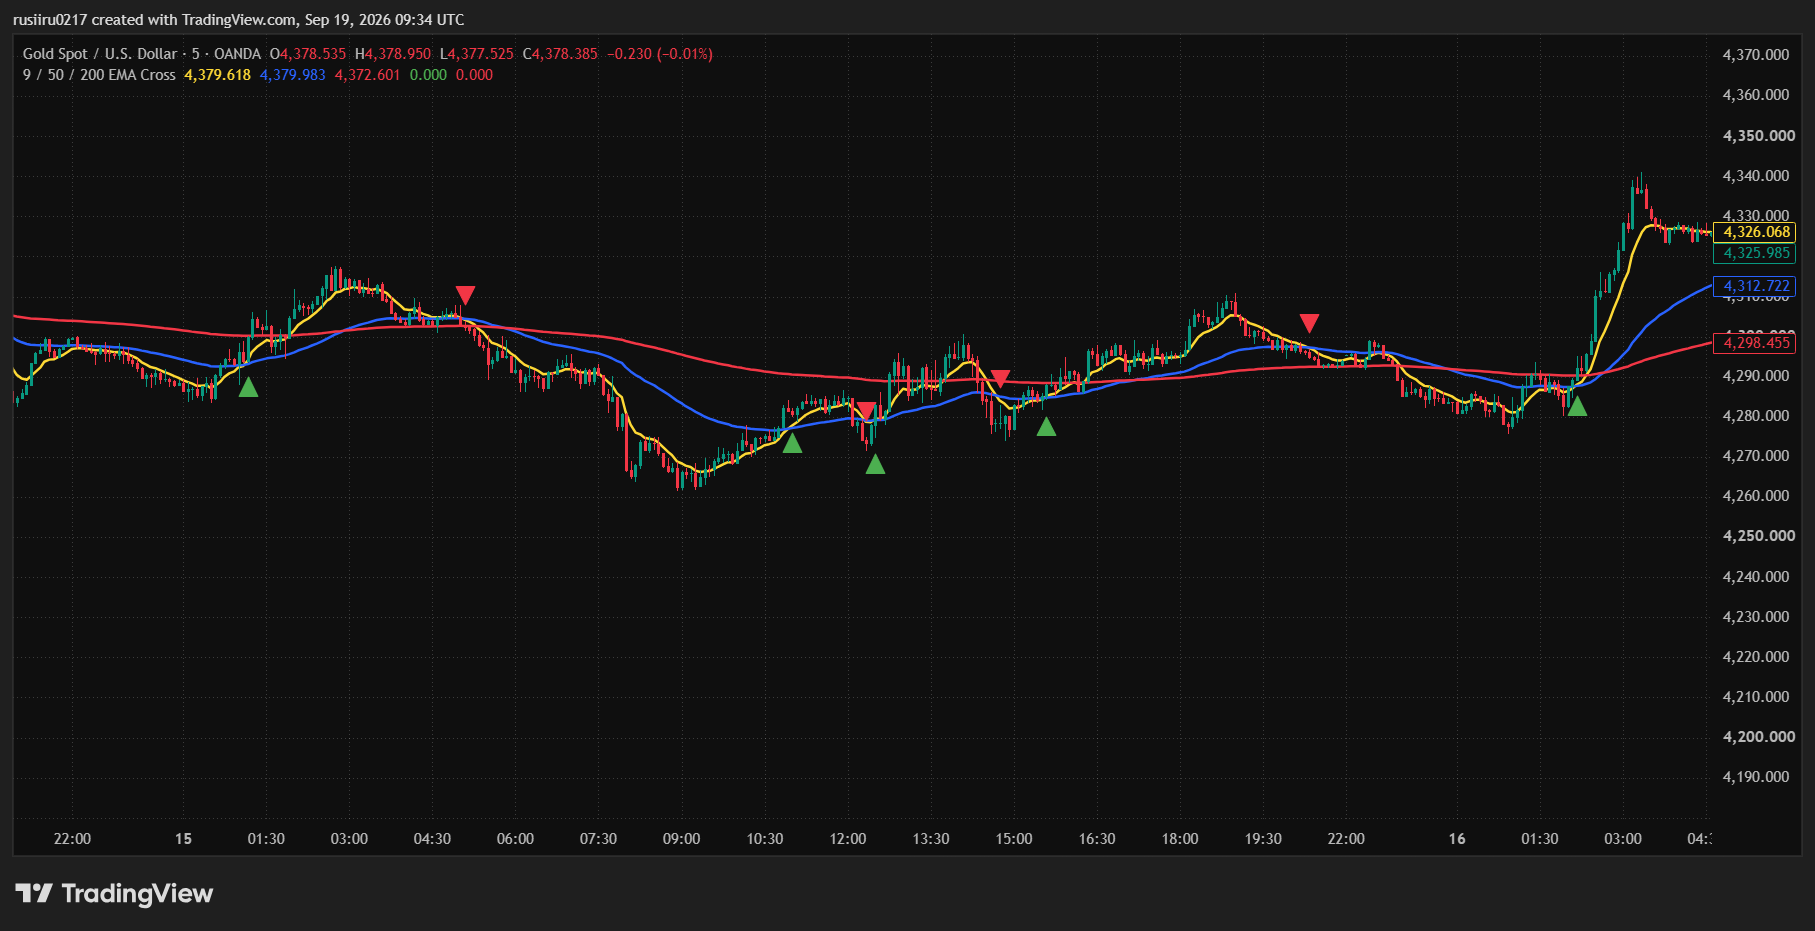
An exponential moving average (EMA) smooths price while giving more weight to recent values. A shorter EMA typically reacts faster than a longer one.
This script calculates all three EMAs from the chart’s closing price and marks crossings between the 9 and 50 EMA.
XAUUSD · OANDA · 5-minute chart. Select the image to enlarge.YOUR LINE-BY-LINE GUIDE
The lengths are fixed in the supplied source. This script has no period inputs in its settings.
Yellow · 9-period EMA.
Tracks recent price changes more closely.
Blue · 50-period EMA.
The reference for the crossover signals.
Red · 200-period EMA.
A longer-period context line.
Supplied TradingView screenshot · XAUUSD, 5-minute chart. A chart view does not establish trading performance. Select it to enlarge.
THE EXACT SIGNAL RULES
| Chart marker | What happened | What it does not mean |
|---|---|---|
| Green triangle below the candle | The 9 EMA crossed above the 50 EMA. | It does not require price or either EMA to be above the 200 EMA. |
| Red triangle above the candle | The 9 EMA crossed below the 50 EMA. | It does not require price or either EMA to be below the 200 EMA. |
| Red 200 EMA line | The 200-period EMA of the closing price. | It does not approve, reject or change the buy/sell signals. |
SETTINGS & ALERTS
The default line width is 2. Plot colors and visibility can be adjusted in TradingView’s Style settings. The 9, 50 and 200 periods are defined directly in the source.
Create separate alerts for EMA 9 Cross Above EMA 50 and EMA 9 Cross Below EMA 50.
Step-by-step alert setup ↗The script has no built-in TP, SL, trailing stop, position sizing or trade execution. It is not a Strategy Tester strategy.
Crosses may occur repeatedly in sideways price movement. On an unfinished candle, a cross can appear and later disappear. An alert set to Once Per Bar Close reduces intrabar triggering, but does not turn the indicator into a guaranteed system.