Supertrend-style overlay
An ATR-based trend line, a narrow buffer and triangle markers when the price and previous trend state meet the signal rules.
01 / THE COMBINED OVERLAY
Trend, volatility, support and resistance—brought together on the price chart, with separate rules for each module.
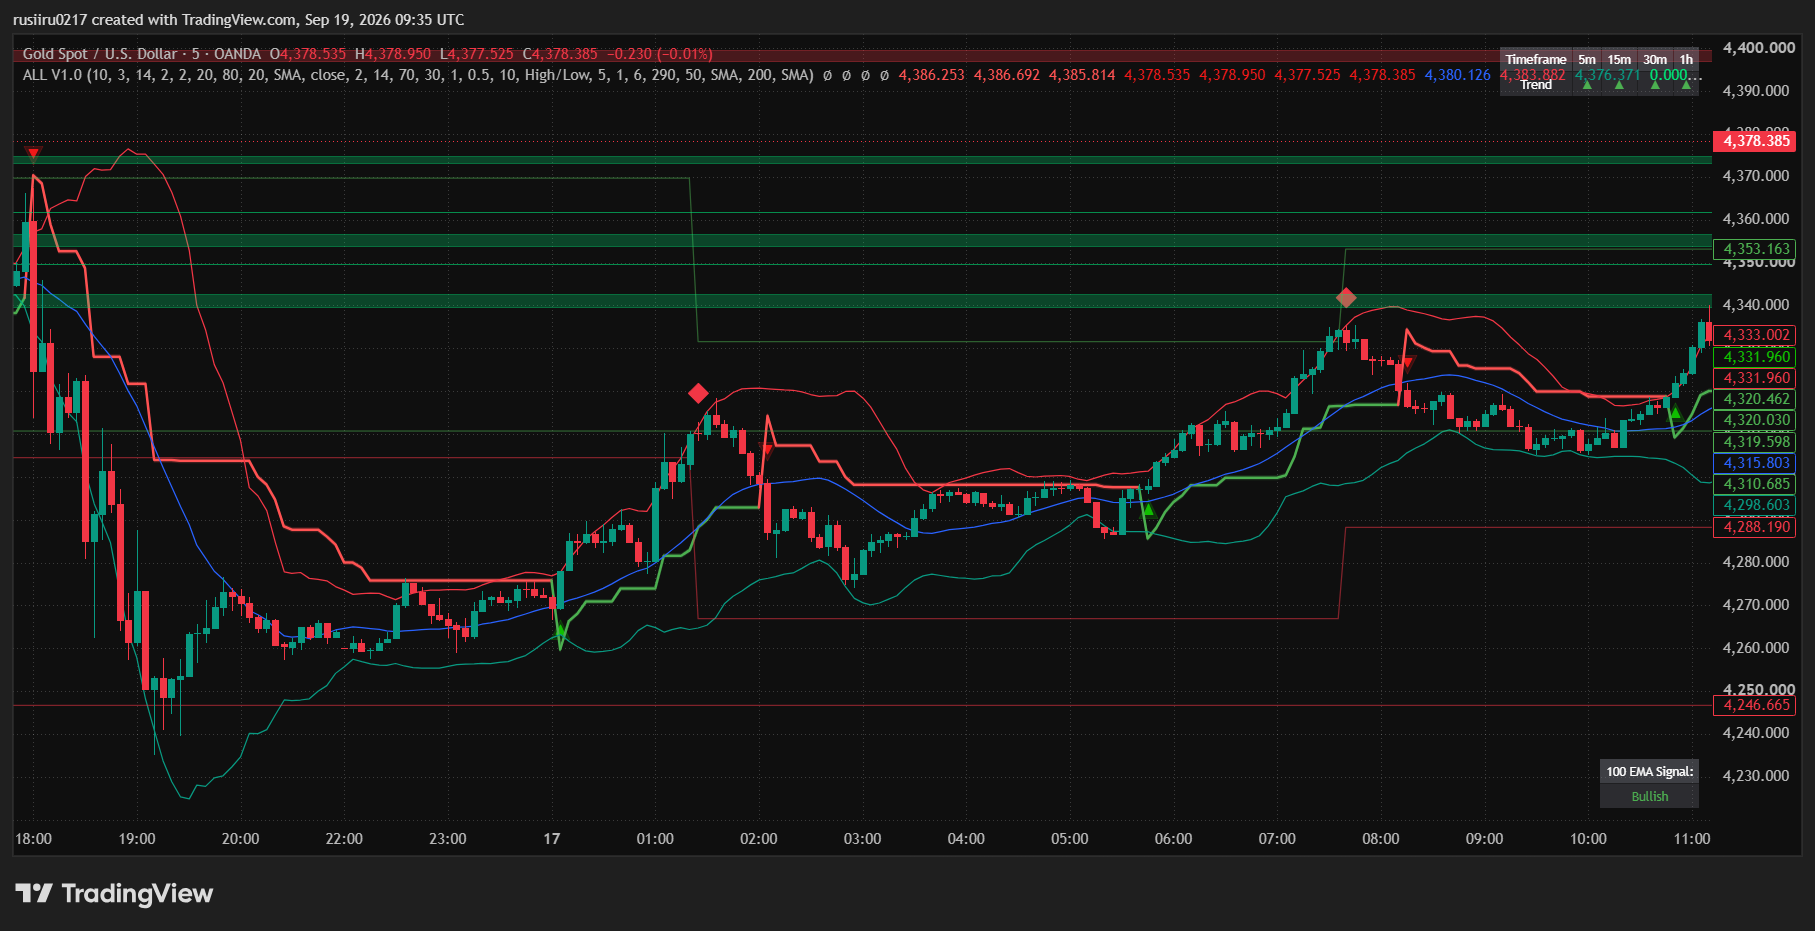
ALL V1.0 combines a Supertrend-style calculation, Bollinger Bands with RSI conditions, pivot-based channels and EMA direction tables.
Use it to examine several aspects of the same chart. The modules do not automatically confirm each other or form one combined trade signal.
XAUUSD · OANDA · 5-minute chart. Select the image to enlarge.INSIDE THE INDICATOR
An ATR-based trend line, a narrow buffer and triangle markers when the price and previous trend state meet the signal rules.
A signal draws an entry-price line, three target lines and a stop line. These are visual reference levels, not broker orders.
Band-cross conditions paired with RSI thresholds create diamond markers. Percentage-based target and stop plots accompany this module.
Confirmed pivot levels are grouped into price zones. Colors show whether a zone is above, below or around the current price.
Compare price with the 100 EMA on the current chart and on fixed 5m, 15m, 30m and 1h timeframes.
The script plots the chart’s OHLC candles and colors them using the corresponding Heikin-Ashi open/close relationship.
READ THE SIGNAL, NOT JUST THE COLOR
| Marker | Trigger in this version | How to interpret it |
|---|---|---|
| Green Supertrend triangle | Current close is above the upper buffer and the previous trend state is bearish. | A price/buffer condition following a bearish trend state. It does not require a BB, RSI, channel or MTF confirmation. |
| Red Supertrend triangle | Current close is below the lower buffer and the previous trend state is bullish. | A price/buffer condition following a bullish trend state; it can change during the candle. |
| Green BB diamond | Selected BB source crosses above the lower band while RSI is below the oversold threshold. | A lower-band re-entry condition with an RSI filter. Default RSI threshold: 30. |
| Red BB diamond | Selected BB source crosses below the upper band while RSI is above the overbought threshold. | An upper-band re-entry condition with an RSI filter. Default RSI threshold: 70. |
| S/R break triangle, if enabled | The current close crosses a channel boundary, with price outside all tracked channels. This can occur before the candle closes. | Optional visual markers; their display toggle does not disable the S/R alert conditions. |
TARGETS & STOPS
The Supertrend module draws levels from the signal bar’s close. With defaults, targets are 2, 4 and 6 times ATR(14) away; the stop is 2 times ATR(14) away. Direction follows the script’s current trend.
A new Supertrend signal replaces the previous set. Levels extend to the right until replaced.
A bar’s high-to-low range has touched that line. A tick is not a recorded profitable trade. The code can mark a touch on the signal bar and does not determine which level was hit first within a candle.
Its defaults are 1% for the target and 0.5% for the stop. Buy and sell plots retain their latest values independently and are not automatically cleared when touched.
A REFERENCE FOR YOUR FIRST SETUP
| Setting group | Default | What it changes |
|---|---|---|
| Supertrend | ATR Period 10 · Factor 3.0 | ATR calculation and trend-band distance. |
| Supertrend TP & SL | ATR Length 14 · TP Factor 2.0 · SL Factor 2.0 | Distances used when a new signal draws its reference levels. |
| Supertrend Visual | Extend Labels 20 bars | How far the current lines and labels extend to the right. |
| Bollinger Bands | Length 20 · SMA · Close · StdDev 2.0 · Offset 0 | Band calculation. SMA, EMA, SMMA (RMA), WMA and VWMA are available. |
| BB + RSI Signals | Length 14 · Overbought 70 · Oversold 30 | RSI conditions for the BB diamonds. |
| BB TP & SL | TP 1.0% · SL 0.5% | Percentage distances from each BB signal close. |
| SR Channel Settings | Pivot 10 · High/Low · Width 5% · Strength 1 · Maximum 6 · Loopback 290 | Pivot grouping and channel selection. Width uses the range of the last 300 bars. |
| SR Channel Extras | Pivot labels off · Break markers off | Optional historical pivot labels and channel-break markers. |
| Optional moving averages | MA 1 off: 50 SMA · MA 2 off: 200 SMA | Additional S/R-module moving averages; these are separate from the EMA Cross tool. |
| MTF Table | On · 5m, 15m, 30m, 1h | Fixed-timeframe price-versus-100-EMA readings; not signal filters. |
Colors, opacity and candle styling are also configurable. The Supertrend buffer is fixed at 0.01% in the source. Changing the BB visual offset shifts the plots, not the underlying signal calculation.
ALERTS INCLUDED
The selectable named alert conditions are SR Resistance Broken and SR Support Broken.
This version has no dedicated Supertrend, Bollinger/RSI or TP/SL alert conditions. Follow the guide to create the supported alerts.
Create an alert ↗