TWO INDICATORS. ONE COLLECTION.Built for TradingView
SureShotExplore the bundle

THE SURESHOT COLLECTION

Your chart.
More context.
One clear view.

Bring trend, volatility and key levels into your TradingView workspace—with two indicators you can install yourself.

Pine Script v62 separate source filesUse together or separately
01 / ALL V1.0CHART STUDY
TREND · VOLATILITY · KEY LEVELSXAUUSD · 5m
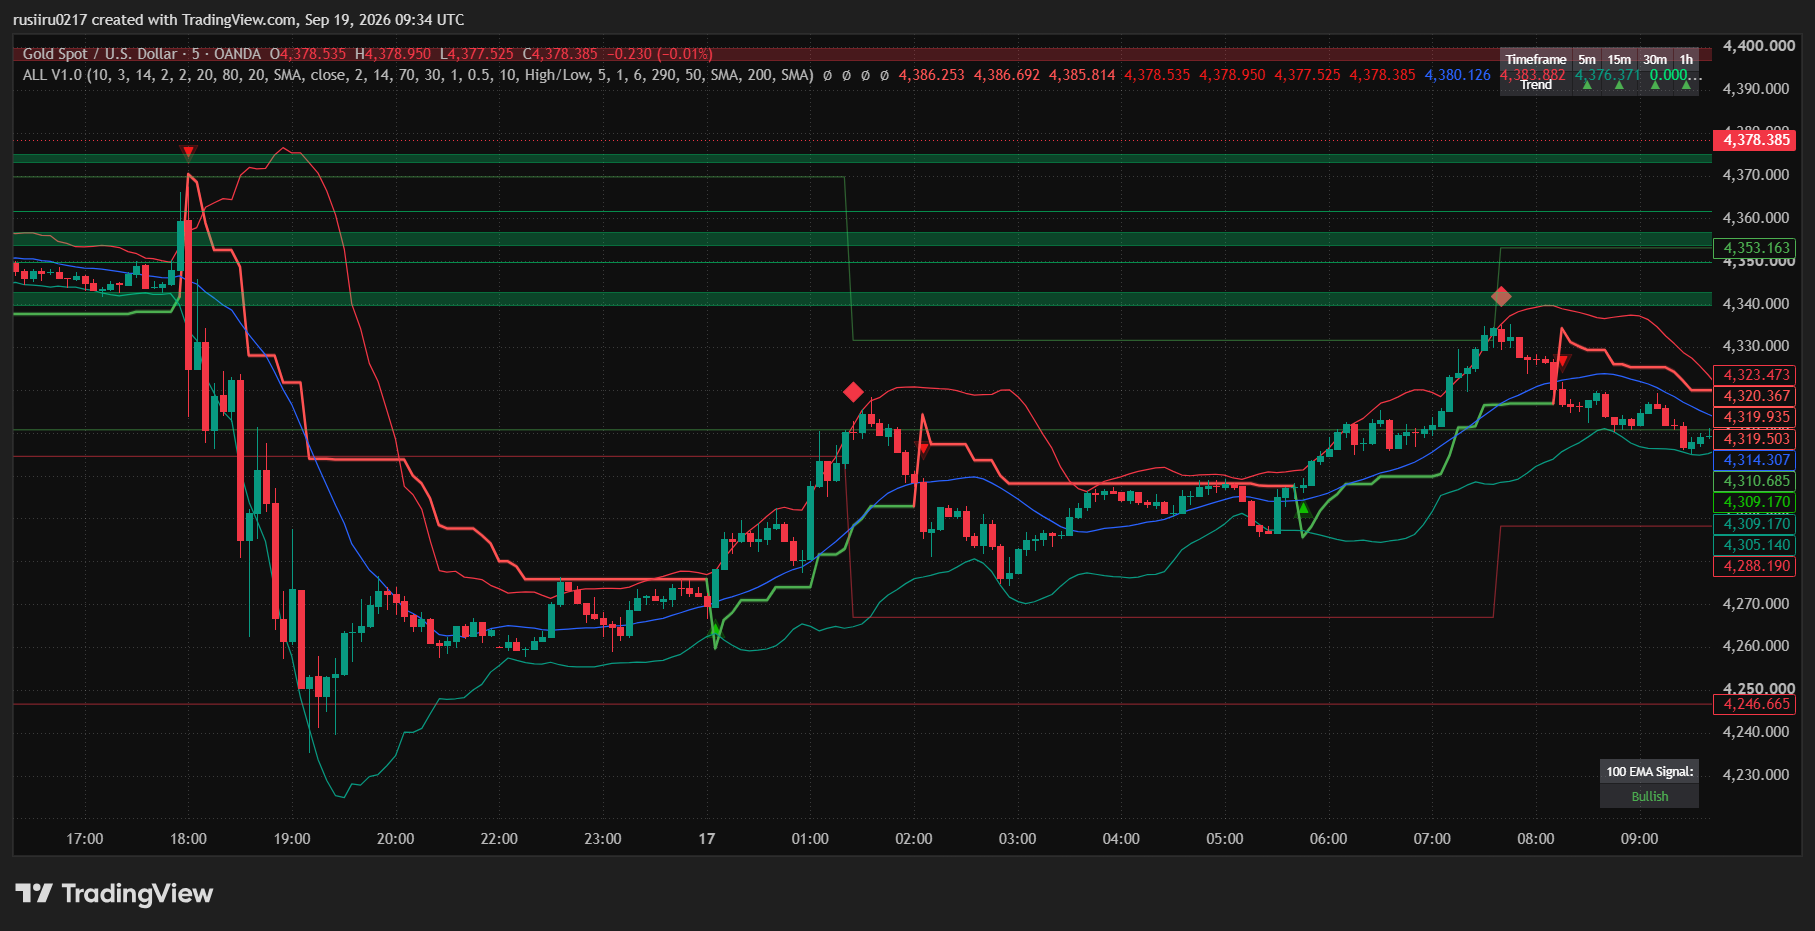
ALL V1.0 on the OANDA XAUUSD 5-minute chart, supplied TradingView screenshot
TradingView chartView full chart
Multiple perspectives.
One overlay.
↗
SupertrendBB + RSIS/R channels
02Main indicators
01Combined analysis overlay
9 / 50 / 200EMA lengths
Your chartYour decisions

A TOOLKIT WITH TWO DISTINCT ROLES

See the whole picture.
Then focus on the cross.

Start with the combined overlay for context. Add the EMA tool for a simpler view of moving-average relationships.

01 / COMBINED OVERLAYXAUUSD · 5m
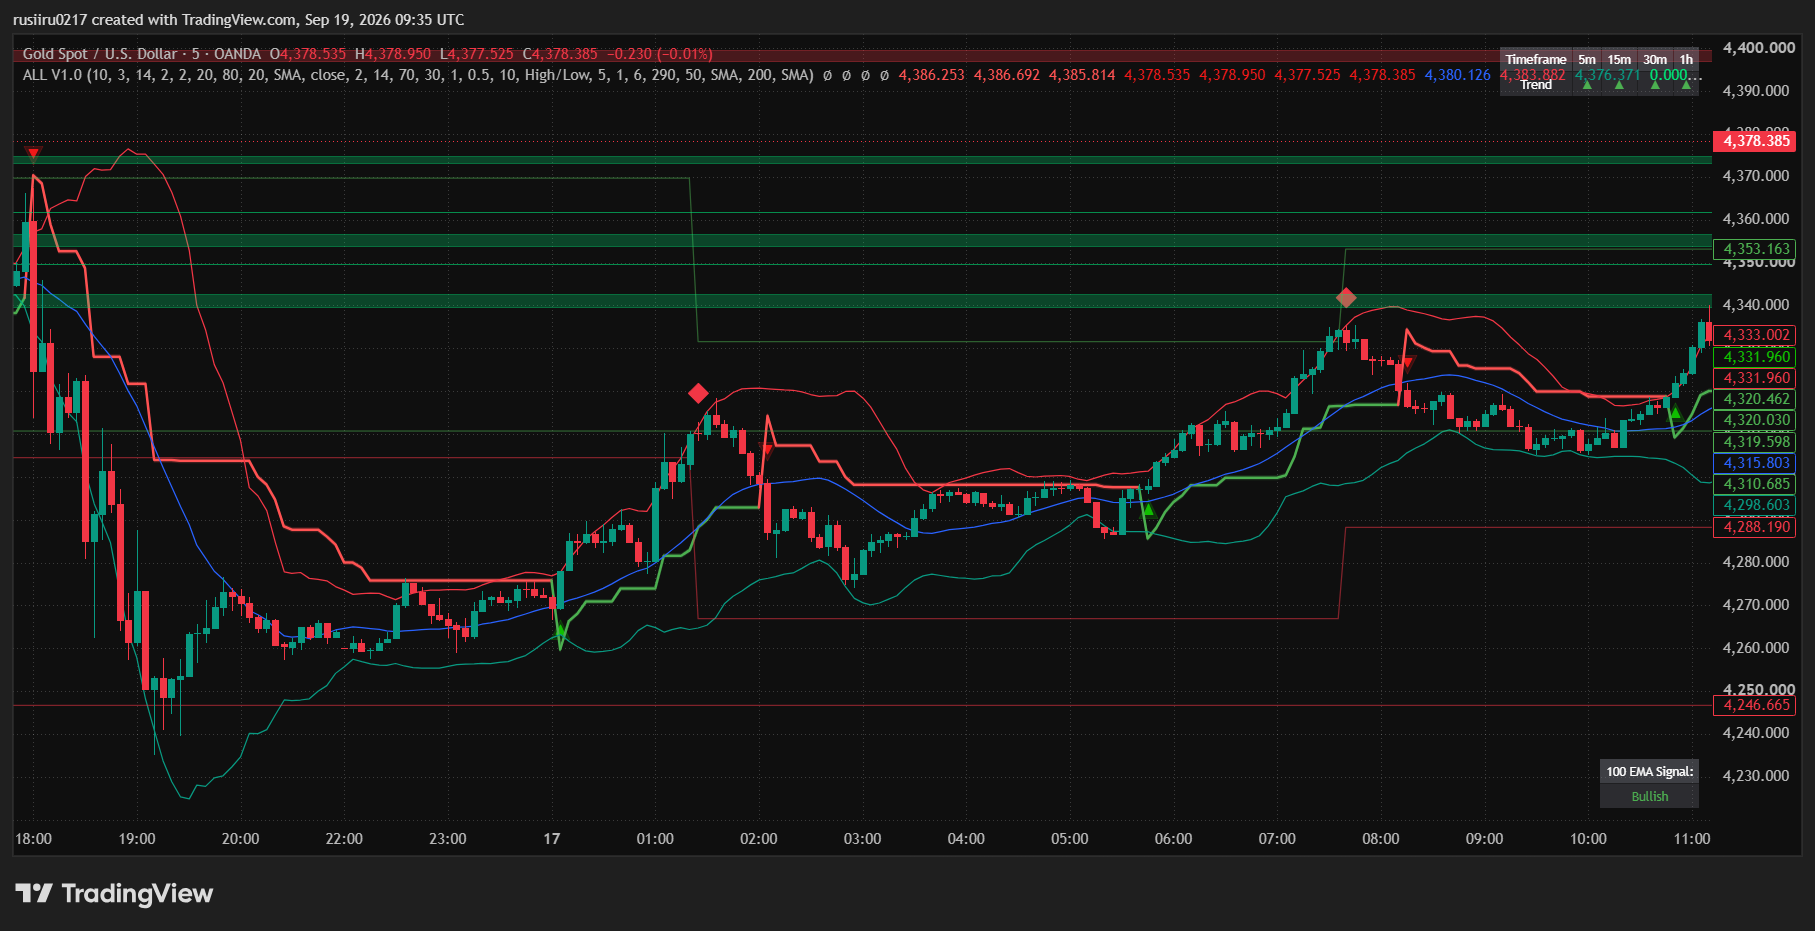
ALL V1.0 on the OANDA XAUUSD 5-minute chart, supplied TradingView screenshot
TradingView chartView full chart

ALL V1.0

Supertrend, Bollinger Bands + RSI, pivot-based support/resistance channels, and EMA trend tables in a single indicator.

TrendVolatilityKey levels
Explore ALL V1.0 ↗
02 / EMA OVERLAYXAUUSD · 5m
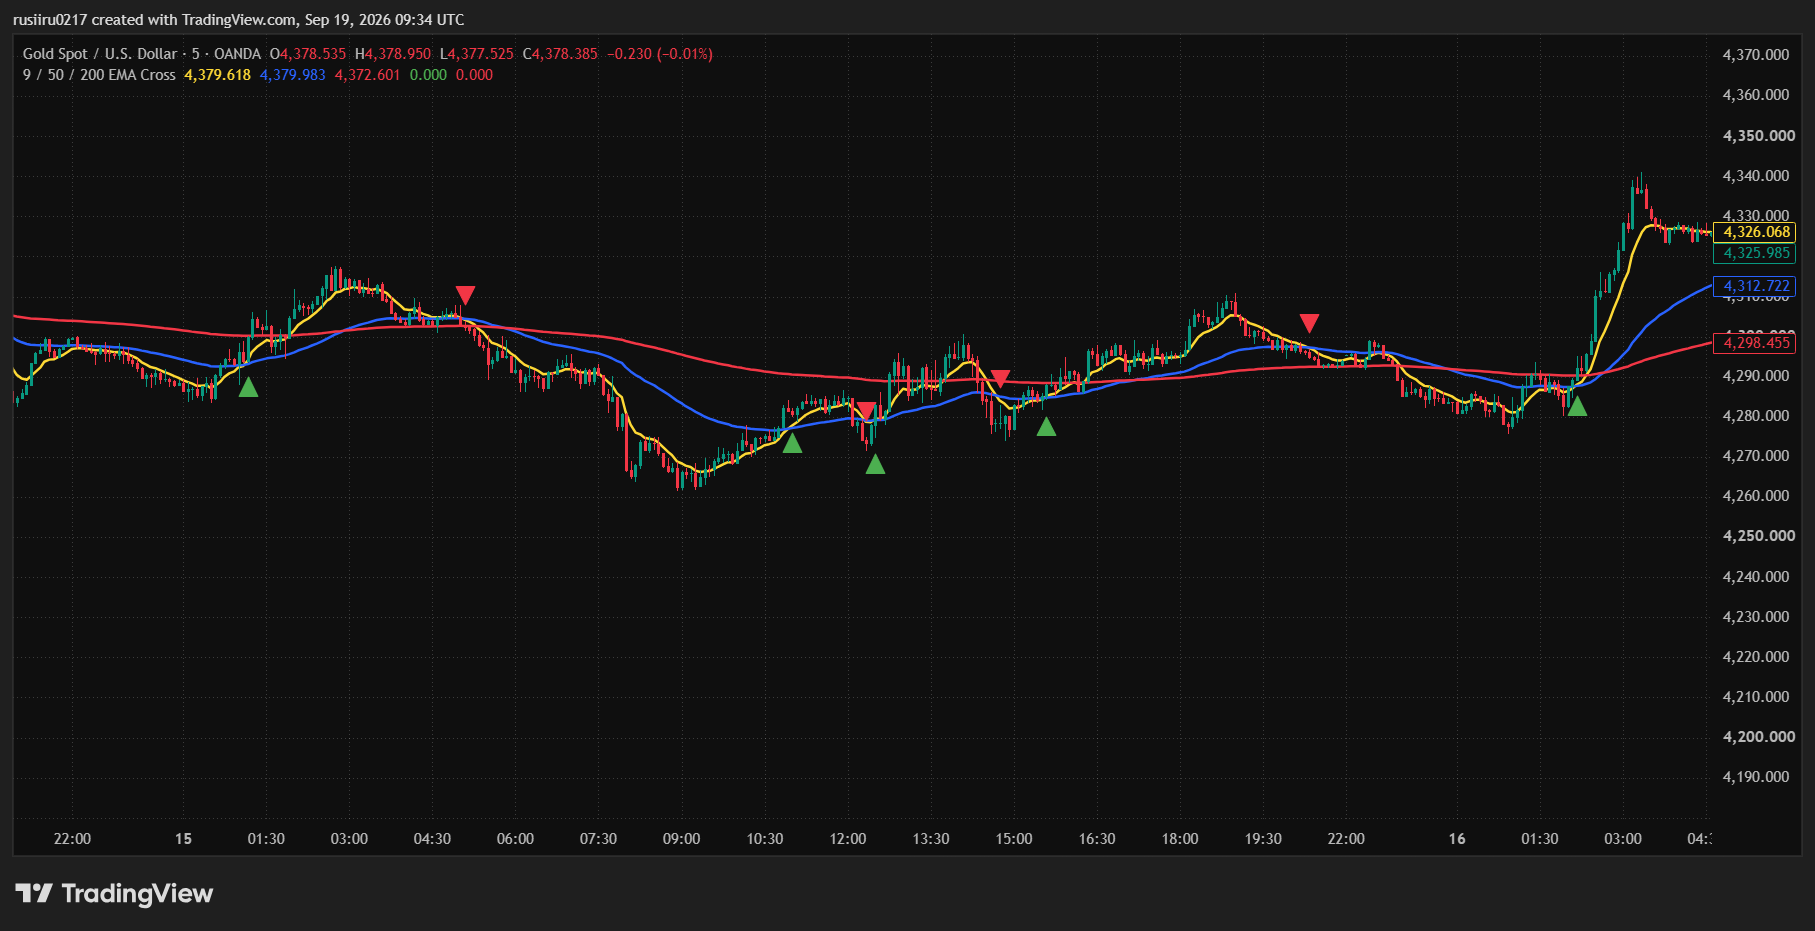
9 / 50 / 200 EMA Cross on the OANDA XAUUSD 5-minute chart, supplied TradingView screenshot
TradingView chartView full chart

9 / 50 / 200 EMA Cross

Three exponential moving averages, with buy and sell triangles when the 9 EMA crosses the 50 EMA. The 200 EMA adds context.

3 EMA linesCross markers2 alert conditions
Explore EMA Cross ↗

UNDERSTAND WHAT YOU ARE SEEING

Every line has a purpose.

Learn the signals and their limitations before using either tool in your own analysis.

EMA CROSS / ON THE CHARTXAUUSD · 5m
Supplied TradingView screenshot showing yellow 9 EMA, blue 50 EMA, red 200 EMA and crossing markers on XAUUSD
9 EMA50 EMA200 EMA

Supplied TradingView screenshot · XAUUSD, 5-minute chart. Select the chart to enlarge.

01

Context first.

ALL V1.0 puts multiple calculations on your chart. Each signal module follows its own rules.

02

Know the trigger.

An EMA buy triangle means the 9 EMA crossed above the 50 EMA. It is not filtered by the 200 EMA.

03

Give the candle time.

Signals on an open candle can change. Understand bar-close alerts and multi-timeframe updates before relying on them.

Learn to read your chart ↗

THE COMPLETE COLLECTION

Two downloads.
A more informed
starting point.

Get ALL V1.0 and EMA Cross together in one bundle. Install each as its own script in your TradingView account.

01
ALL-V1.0.txtCombined analysis overlay
TXT
02
EMA-9-50-200-Cross.txtStandalone EMA overlay
TXT
Read the complete installation guide ↗
THE TWO-INDICATOR BUNDLE2 SOURCE FILES

Both tools.
Your own workspace.

ALL V1.0 + 9 / 50 / 200 EMA Cross.

$460
USD · one-time bundle priceStandard price $600Save $140
  • Two separate Pine Script source files
  • Combined overlay + standalone EMA overlay
  • Step-by-step TradingView installation guide
  • Product, settings and alert reference
  • 24-hour email support

Continue to Whop to review the final amount, purchase terms and complete your payment.

After payment, open SureShot → Files in Whop to download both indicators.

TradingView accounts, subscriptions and market data are separate. Review the final purchase terms at checkout.

NO CODING EXPERIENCE NEEDED

From file to first chart.

Follow every step ↗
01 /

Download both files.

After payment, sign in to Whop with the account you used at checkout. Open SureShot → Files and download both source text files separately.

02 /

Paste, save, add.

Open a file in a plain-text editor. Copy its code into a new TradingView Pine indicator, save it, then add it to your chart.

03 /

Learn the settings.

Repeat for the second file. Use the guide to identify each line and marker before changing the defaults.

BEFORE YOU START

A little clarity
goes a long way.

All questions & answers ↗
Are these two indicators or four?

Two main indicators. ALL V1.0 contains several analysis modules; 9 / 50 / 200 EMA Cross is a separate script. The bundle contains two source files.

Will they place trades for me?

No. Both scripts draw chart information and support selected alerts. They are indicators, not automated trading systems or Strategy Tester strategies.

Can the signals change?

Yes. Both indicators evaluate live candle data. ALL V1.0 also uses multi-timeframe values and delayed pivot confirmation. See the product pages for the exact behavior.

HERE TO HELP

Contact our
support team.

Questions about the indicators, your downloads or TradingView setup? Get in touch with the SureShot team.

24-HOUR EMAIL SUPPORT

Let’s get you set up.

Tell us which indicator you’re using and what you need help with. Include a screenshot if you’re seeing an error.

[email protected]

Indicator chart

Selected indicator chart
Original screenshot · prices and signals unchangedOpen original size ↗